

Alperen Okur, Cankat Kuşkonmaz, Serpil İşbilen, Hilmi Aytaç / Bursa Beton A.Ş.
Abstract
The method of determination of in-situ compressive strength is adopted in order to determine the concrete quality in the new concrete structure or to evaluate the damaged old structure to be redesigned. The studies on the in-situ compressive strength generally take into account a fixed age and the data obtained at that age are analyzed, and accordingly studies are finalized. However, there is a lack of enough studies on how the time-dependent change of in-situ compressive strength occurs. In this study, 1:1 scale structures (floor height 2.80 m, slab area 9.00 m2) were constructed in the laboratory field using the mixtures prepared in C30/37 strength class, and then cores were taken from the columns of these structures and subjected to compressive strength test at different ages for 560 days (nearly 1.5 years). The obtained strengths were compared with the strengths of standard concrete samples of the same ages. The results of the experiment showed that the strength development of standard sample and core sample were similar.
Keywords: Compressive strength, in-situ compressive strength, core strength, strength development
1. Introduction
Because compressive strength is the most basic characteristic which determines the quality of the concrete, an accurate definition of this parameter is very important, where the quality inspection is done according to the conformity criteria specified in the standards TS EN 206 [1] and TS 13515 [2]. As part of this process, the values obtained as a result of compressive strength experiment are first correlated with the characteristic strength values, then leading to the acceptance or refusal of the concrete. On the other hand, the standard TS EN 12390-2 [3] specifies that the sampling for quality inspection must be submerged in water at 20±5 °C while remaining in the formwork, and at 20±2 °C after having stripped of the formwork until the experiment day, and, similarly, the issues related to the maintenance of the structural elements of the construction under either ordinary or extraordinary weather conditions.
As is known, samples are left in the construction environment during the first day after they are taken. At this point, it is of outmost importance to take necessary measures in the site so that concrete samples prepared in the delivery site can be stored under suitable humidity and temperature conditions. Otherwise, variances may occur across strengths of samples. Furthermore, structural safety understanding takes a strength value of sample for 28 days as a criterion, and accordingly any questions related with development strength either until 28th day or after 28th day will be answered over “samples” stored under standard conditions or conditions affecting the building element, and parties finds acceptable and assumes as a representative of the structure, to use samples as the interpretative indicator of the development of required strength. Yet, the samples and in-situ concrete will show different reactions against the temperature, humidity and compression conditions in terms of the size-volume relation, even if the samples are stored under the conditions of the site, which suggests the possibility of a deviation between sample and building element in terms of either strength development or final strength. On the other hand, the deviation will even be at higher levels, considering the lack of the awareness on the protection of building elements in our country, except for large projects. Therefore, the knowledge on the time-dependent strength development between in-situ concrete and the samples taken before application will give important insights about the safety of the buildings.
In the literature survey, although there are many studies on the in-situ strength evaluation, there are only a few studies on the strength variance in the long run. A study surveyed the core strength and standard sampling strength of concretes having different strengths (25~55 MPa) at different times during a period of 270 days, where, for concretes at having a moderate strength, core strengths up to 270 days were found to be higher than 28-day cube strengths. However, core strengths at higher strength levels were found to be lower than 28-days cube strengths [4].
In the study, 1:1 scale structures (floor height 2.80 m, slab area 9.00 m2) were constructed in the laboratory field using the mixtures prepared in C30/37 strength class. Standard sampling was carried out during construction, some of which were stored in the laboratory environment and the remaining in the construction environment. The cores taken from columns of the structure, samples stored under same conditions as structure, and samples stored under the laboratory conditions were subjected to compressive strength experiments at different ages for 560 days (around 1.5 years) and the relation among results are demonstrated.
2. Experimental Study
2.1 Materials
2.1.1 Cement and Fly Ash
The chemical and physical properties of CEM I 42.5 R type cement, conforming to the standard TS EN 197-1, and fly-ash conforming to the standard TS EN 450-1 are given in the Table 1 and Table 2, respectively.
Table 1. Chemical and physical properties of cement

Table 2. Chemical and physical properties of fly-ash

2.1.2 Chemical Admixture
Modified polycarboxilate based super plasticizer conforming to the Standard TS EN 934-2 is used in the mixture. Admixture rationed to 24.27%, its density is 1,074 and pH Value is 5.70.
2.1.3 Aggregate
In the study, crushed limestone procured from single source is used. Properties of aggregates ar e given in the Table 3.
Table 3. Aggregate properties

2.2 Study Method
In the study C30/37 Class concrete is used. The mixture ratios of the concrete are given in Table 4.
Table 4. Mixture ratios (kg/m 3)
![]()
In the laboratory field, 1:1 scale structures (floor height 2.80 m, slab area 9.00 m2) were constructed. A total of 30 cube samples with 100mm edges were taken from the produced concrete in order to be crushed at different days. 15 of them were stored in the standard curing conditions (laboratory) and 15 in the actual construction site (site). Also, a total of 30 core samples, which slenderness ratio is “2.00”, were taken from the columns of the building being constructed for relevant experiment duration (6 per experiment duration). Grinding method was employed in smoothing round the ends of core samples. A coefficient of 0.95 was used for strength conversion of the cube samples. All samples were subjected to compression test at 28th day, 120th day, 240th day, 365th day and 560th day and sample averages per each series were included in the experiment results. Experiment schedule is briefly given in the Table 5.
Table 5. Information about compressive strength experiments

The constructed structure was wrapped around with curing blanket to keep it moisturized all the time for 28 days during which the samples stored under the conditions of site were also wetted. This application was ended at the expiry of 28th day, after which both structure and samples were left under the atmospheric conditions. Samples taken for laboratory conditions were stored in the curing pool at 20±2 °C from the first day until the time of relevant experiment.
The Figure 1 shows air temperatures to which the structure constructed was subjected during 560 days. The temperature values were determined by means of thermocouples, and at least one measurement were taken daily during the experiment period. The structure was subjected to temperatures ranging from -2 °C as the lowest to 37 °C as the highest during 560 days, which averaged at 18 °C.
Figure 1. Air temperatures ( oC )

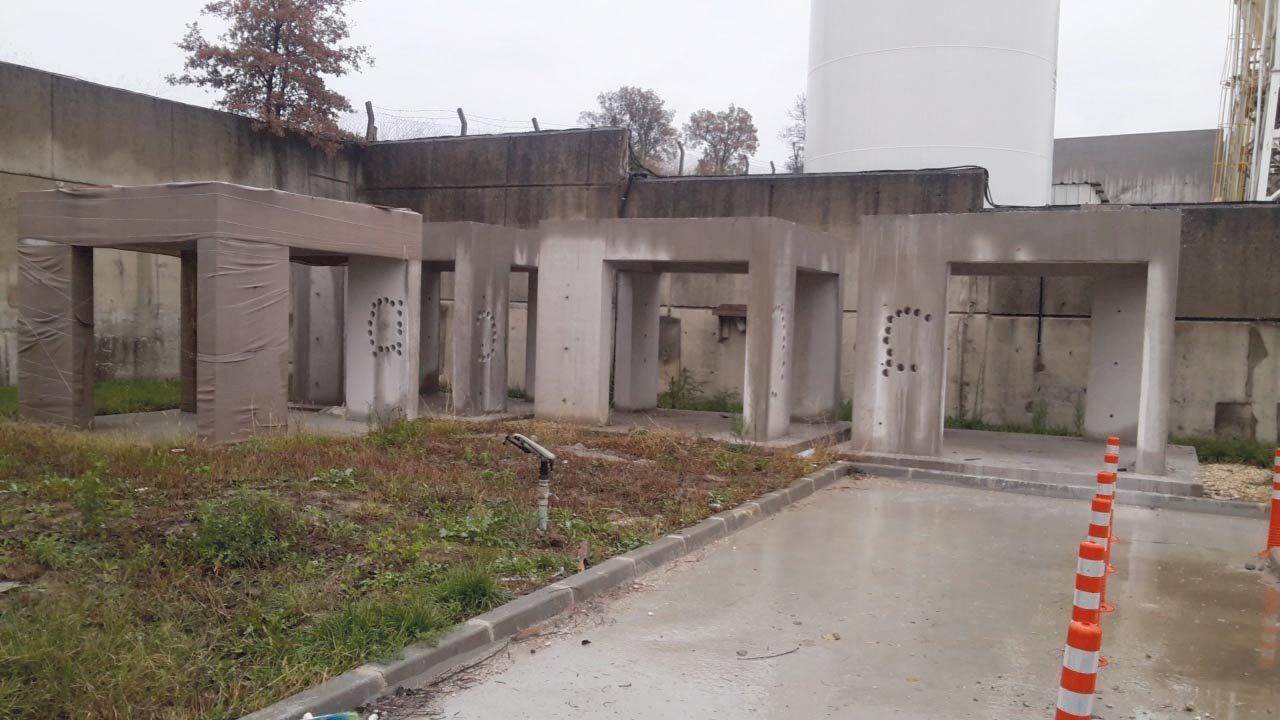
Picture 1. The constructed structure and core zone
3. The Evaluation Of Experiment Results
The Figure 2 shows the strength development of the standard samples both in the laboratory and site environment. During the initial 28 days, the minimum temperature in the external ambient conditions recorded as 9 oC and max 31 oC, averaging at 19 oC and a difference of approx. 4 MPa occurred between site samples and laboratory samples in the 28-days strengths with the contribution of variable ambient air humidity. The strength class of the samples stored in the site resulted at the levels of C25/30.
Laboratory samples demonstrated a steeping strength gain until 120th day, after which, however, strength gain dramatically sloped down to almost zero levels. In this case, despite the course after 560 days remained unknown, it can be said that final strength was achieved at the end of 120th day. Site samples demonstrated a near linear development in the strength gain. Taking all these into account, it is possible to state that strength developments in both two environments share a similar development. The samples stored in the laboratory conditions for each experiment durations produced a strength of approximately 1 upper class compared to the site samples. On the other hand, samples in the both conditions reached in themselves up to strength of approximately 2 upper class after 560 days. This is significantly a result of the use and higher amount of fl y-ash.
Figure 2. The strength development of the standard samples both in the laboratory and site environment.

Table 2 shows the core strengths. The results of the samples which strength values demonstrated a deviation compared to others were not considered in the calculation of average for the same experiment duration. These deviations were considered to be caused by defects during grinding.
Table 6. Core strengths

*Not considered in the calculation of aver age
The Figure 3 shows the strength development of the site samples and core samples. Although strength values seemed to be very similar, the point to take into consideration is the fact that “because of slenderness value being “2.00”, their core strengths correspond to a strength of approximately 2 upper class compared to site samples”. On the other hand, the strength development of both series samples are almost similar to each other. Also, samples in the both conditions reached in itself up to strength of approximately 2 upper class after 560 days. Again, this is significantly a result of the use and higher amount of fly-ash.
Figure 3. Strength development of the site samples both and core samples

The Figure 4 shows the strength development of the laboratory samples and core samples. Although core strengths are seen to be lower, it can be said that strength classes in both series are approximately similar due to the effect of the slenderness value. In other worlds, even if in-situ structural element was not cured during 560 days, it reached up to a strength similar to that of samples that were continuously cured during the same period thanks to the positive effect of the size factor.
Figure 4. Strength development of the laboratory samples and core samples

Figure 5 shows the relative strength development rates. Laboratory samples demonstrated an increase of 25% at 120th day compared to 28th day, whilst the same rate remained lower for other series. This shows that pozzolanic activity got effected from curing sensitivity in the period from 28th day to 120th day (25% increase in 90 days). Standard curing in this period led to increased rate of strength development. It can be stated that standard curing in the course from 120th day to 560th day did not have any noteworthy effects in the strength gain (4% increase in 440 days).
In the period from 120th day to 365th day, the effect of curing handicap was extinguished in the strength of site samples, after which it was evened out with the rate of strength development of laboratory samples. Both series showed an increase in the strength by 30% compared to 28th day at the end of the study (around 1.5 years).
It is possible to state that core samples showed an increase by about 23% in real terms and by about 25% generally in 560 days.
Figure 5. Relative strength developments

3. Conclusion And Suggestions
This study mainly aims at finding an answer to the question if the strength development of the concrete in the structure stored in entirely random environment in terms of temperature and humidity in the long run is different than that of standard samples and depending on the answer, if necessary, generating data to used for new approaches to be followed with respect to structural safety. As a result of the study, following conclusions are arrived and according suggestions are provided below:
Not only the development course of the strength but also the final strength development rate of the concrete in the structure were resulted very similar to those of standard samples. Therefore, there is no requirement that will necessitate adopting alternative methods than the current ones for strength development of the concrete in the structure (sampling after storage under either laboratory or in-situ conditions).
It is observed that, in the course of post-28th day, storage of samples under standard temperature and humidity conditions (laboratory) does not lead to significant difference, compared to samples under in-situ conditions (site), in terms of development trend of strength. The main point here that needs attention is the fact that even if the strength developments are similar, the samples under standard conditions produced approximately 1 upper strength class compared to the samples under in-situ conditions. Although it is impossible to reach a relative humidity of 100% and a temperature of 20 oC in the structure, it will have benefits if methods are developed to keep structural element humidified for at least 3-4 months to achieve higher values of strength. However, it must be noted that said period will vary depending on the type and amount of the mineral admixture to be used.
According to core results, the problem that structural element was not cured for 560 days seemed to be eliminated thanks to the positive effect of the sampling size. It would be of beneficial to take care of using equal slenderness values between core and standard samples for more sound results when similar studies is to be carried.
For about 1.5 years (560 days) either laboratory or in-situ or core samples had similar strength development even though there were subjected to different conditions, and each sample series had generally demonstrated an increase by 25-30% in strength in the period from 28th day to 560th day. This result means that the applied concrete has reached up to a strength of approximately 2 upper class. The use and amount of mineral admixture is the most important factor in achievement of such strength. Therefore, it must always be necessary to use mineral admixtures in ample amounts in order to contribute in the structural safety.
The interpretations to be made on the results of this study must take into account the use of fly-ash, fly-ash/cement ration being “0.40”, and the air temperatures as explained in the section of study methodology. Please note that if one of these parameters varied, one or several of above judgments might change, as well .
References
- TS EN 206: Concrete-Characteristic, Performance, Production and Conformity
- TS 13515 : C omplementary Standard to Application of TS EN 206
- TS 12390-2 : Concrete – Cured Concrete Experiments – Part 2: Preparation and Curing of the Experimental Samples For Use In Strength Experiments
- Radhi, M. S., Salih, S., Joni, H., H., “Effect of Age on Concrete Core Strength Results”, The 2nd International Conference of Buildings, Construction and Environmental Engineering (BCEE2-2015), At American University of Beirut, Volume: 2, October, 2015.

")

